

SOLUTION BRIEF | INSIGHTS DASHBOARD | SEMICONDUCTOR AND EDA
Every file has a value. Now you can see it.
See what is irreplaceable, what simulations can rebuild, and what old tapeouts still cost to store, from the enriched metadata catalog.
Millions
saved on storage each year at a global semiconductor company
103B+
files indexed at the same company
4,000
engineers supported
At a glance.
Key challenges.
Chip teams keep layouts, tapeouts, simulations, and logs on many systems. Regression runs pile up on fast storage, and nobody is sure what is safe to remove.
The solution.
The Insights dashboard groups storage by its role in the design flow, from IP and layouts to waveforms and scratch. It reads metadata only, never file content.
Why it matters.
Protect tapeouts and IP, clear what a simulation can rebuild, and move old tapeouts to lower-cost storage before you buy more.
What the dashboard shows.
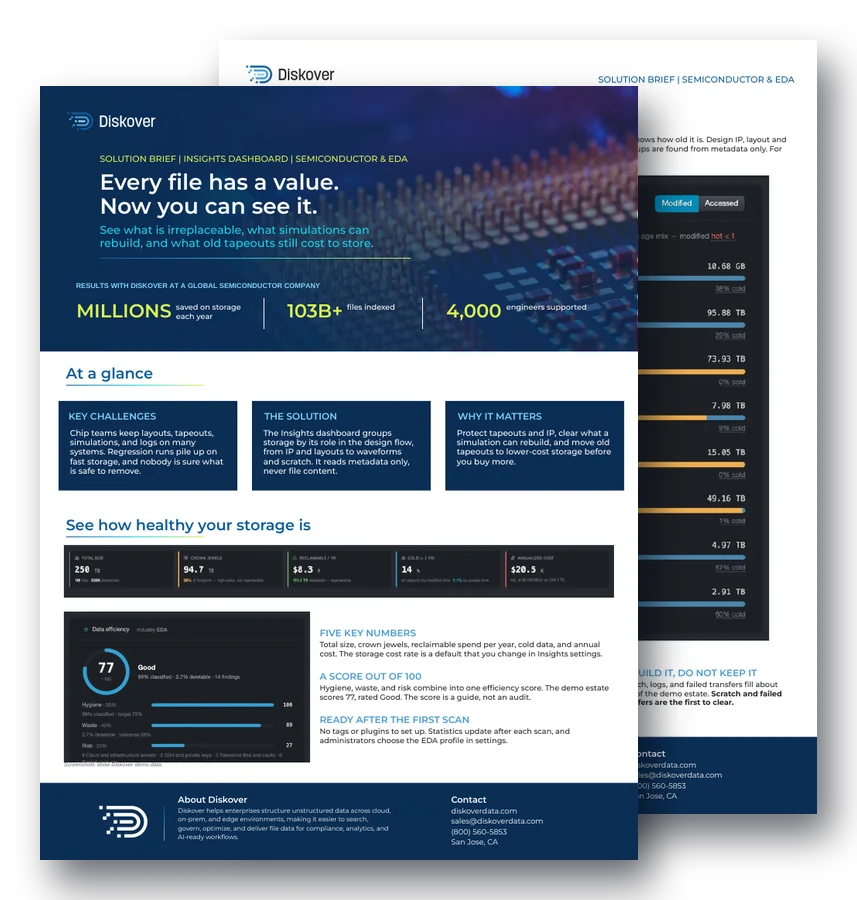
Five key numbers.
Total size, crown jewels, reclaimable spend per year, cold data, and annual cost. The storage cost rate is a default that you change in Insights settings.
A score out of 100.
Hygiene, waste, and risk combine into one efficiency score. The demo estate scores 77, rated Good. The score is a guide, not an audit.
Sorted by what it is worth.
Design IP, layout and tapeout data, and PDKs are crown jewels. Waveforms, intermediate files, and scratch can be rebuilt. For example, layouts are .gds, .oasis, .lef, or .def files in folders such as /layout/ or /pnr/.
Hot, warm, and cold.
Data temperature shows how much design data is idle, and rebuildable files still in use are kept apart from stale ones, so you clear only what is safe to clear. Administrators set the age limits in Insights settings.
Redundant, obsolete, and trivial.
Reclaim sorts wasted space into three groups and shows the size, yearly cost, and top file types for each. In the demo, 55.7 TB is recoverable, about $4.6K a year. The groups can overlap, so the total is an upper bound. See ROT data.
Who owns it, and how fast it grows.
Design storage is shared by RTL, verification, physical design, and CAD teams, plus automation accounts, so nobody owns the bill. Ownership shows which teams hold the most space, and Space used over time shows how fast it grows, so the next purchase is based on facts.
How it works.
1. Scan
STORAGE OR IT TEAM
Diskover scans your storage. No tags or plugins to set up, and statistics update after each scan. Administrators choose the EDA profile in settings.
Example: the dashboard is ready after the first scan.
2. Classify
AUTOMATION
Workflow classification groups storage by its role in the workflow, gives each group a value tier, and shows how old it is. Groups are found from metadata only.
Example: crown jewels are separated from files that can be rebuilt.
3. Prioritize
ANY AUTHORIZED TEAM
Top actions ranks every fix by what it is worth. Each one (delete, move, or rotate) shows its size, its yearly cost, and the score points it adds.
Example: an administrator starts with the fix worth the most.
4. Act
BY POLICY
Diskover policies then do the work on the schedule you set, and the AI Connector answers storage questions in plain language. Every action it proposes waits for human approval.
Result: storage spend goes to the data that is worth keeping.
What the demo estate shows.
Crown jewels first.
Layout and tapeout data fills 38% of the demo estate. Insights also finds PDKs, a data type that is usually export-controlled. These are the files to protect before any cleanup.
Old tapeouts on disk.
Tapeout packages take 42.8 TB in the demo, and 65% of them are cold. That is finished work still sitting on primary storage.
Rebuild it, do not keep it.
Scratch, logs, and failed transfers fill about 20% of the demo estate, and log files alone take 38.5 TB. Scratch and failed transfers are the first to clear.
Questions people ask.
What is the Diskover Insights dashboard for EDA?
It groups design storage by its role in the flow, from IP and layouts to waveforms and scratch, gives each group a value tier, and shows its age, cost, and what can be reclaimed.
Does the Insights dashboard read design files?
No. Groups are found from metadata only, such as extension and folder path. For example, layouts are .gds, .oasis, .lef, or .def files in folders such as /layout/ or /pnr/.
What do I need to set up?
Nothing beyond the scan. There are no tags or plugins to set up, statistics update after each scan, and administrators choose the EDA profile in settings.
How does the dashboard decide which fix to make first?
Top actions ranks every fix, such as delete, move, or rotate, by its size, its yearly cost, and the score points it adds. Diskover policies then do the work on the schedule you set.
What is the efficiency score?
Hygiene, waste, and risk combine into one score out of 100. The demo estate scores 77, rated Good. The score is a guide, not an audit. See storage cost optimization.
Related resources.
See it on your own data.
We’ll index a sample of your environment and show you
what’s recoverable against your current storage spend.