

BLOG
Everyone sells data intelligence. Ask what it can see.
September 16, 2026 · 6 min read
Three vendors, one afternoon, three slides with the same title. The first shows customer orders by month, straight from a database. The second shows a storage array at 91% with a forecast line. The third shows a list of files nobody has opened since 2019, with an owner beside each one. All three called it data intelligence, and all three were telling the truth.
The words are the same because the market likes them. What each one describes is different. Pick the wrong one, and you pay for answers to someone else’s question.
File-level data intelligence is the set of facts about every file you store, collected into one catalog you can query. Those facts include each file’s type, size, age, owner, location, and business context, and they answer questions about the files themselves rather than the records inside them or the disks beneath them.
The same words can mean rows, volumes, or files.
A simple way to picture it: a database sees records, a storage system sees disks, and file-level data intelligence sees your files.
Data intelligence about records lives in a database or a warehouse. It tells you what your customers bought, which invoices are late, and how a campaign performed. The unit is a row, and the tools that read rows are excellent at it.
Data intelligence about storage lives in the array or the cloud console. It tells you how full a volume is, how fast it is growing, and what it costs per month. The unit is storage capacity, on a disk or in a cloud bucket, and the vendor who sold the storage is the right source for it.
Data intelligence about files sits between those two. The unit is a file: the contract, the scan, the render, the simulation output, the spreadsheet someone exported in 2021 and never deleted. Its facts are the file’s name, path, size, owner, three timestamps, and whatever else you attach. Each answers the question it was built for. The trouble starts when a question about files gets sent to a tool built for rows or volumes, and comes back incomplete.
The recognition test is a task you have been given. “Find every database backup older than two years, across the file shares and SharePoint, and tell me who owns them.” A warehouse has no column for that. A capacity report says 91% and stops. The question is a file question, and it needs a file answer.
Which of your open tickets went to the storage team but asks about files?
What file-level data intelligence looks like across a live estate.
The views below come from the Diskover demo environment, where every estate, folder, and file name is sample data. They are a small sample of the standard and custom analytics Diskover offers, and every one reads the same metadata catalog. The estates are small on purpose. The same patterns appear at 8 petabytes (PB).
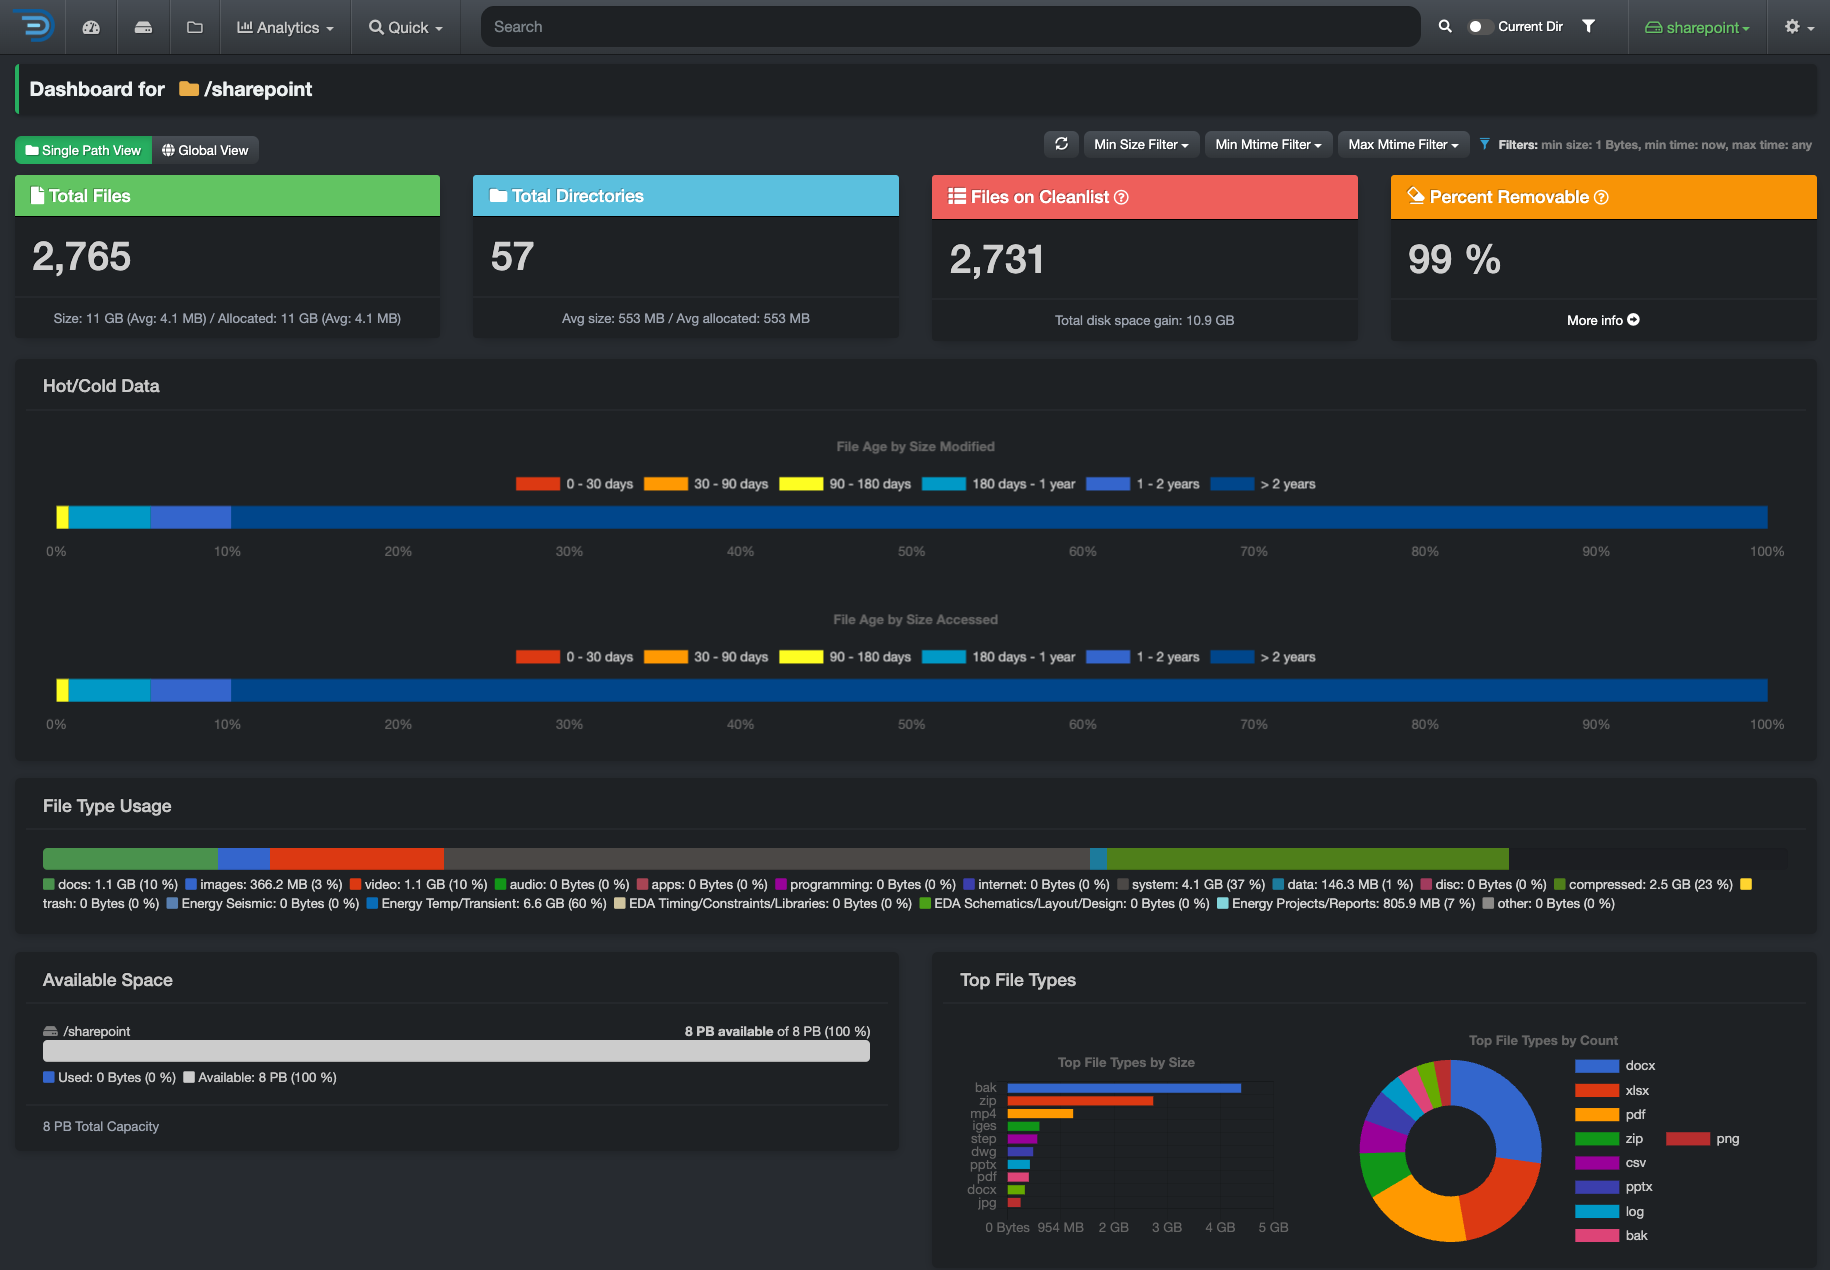
The first view is the dashboard for one SharePoint location with 2,765 files. Two bars answer the first question anyone asks: how much of this has been touched recently. Most of the capacity was last modified more than two years ago, and the accessed bar tells the same story. Below it, the file-type mix says what the estate is made of: documents, video, compressed archives, and system files. The same dashboard offers a global view option that rolls every indexed location into one set of numbers, so the question “how cold is the whole estate” has the same answer shape as “how cold is this share”.
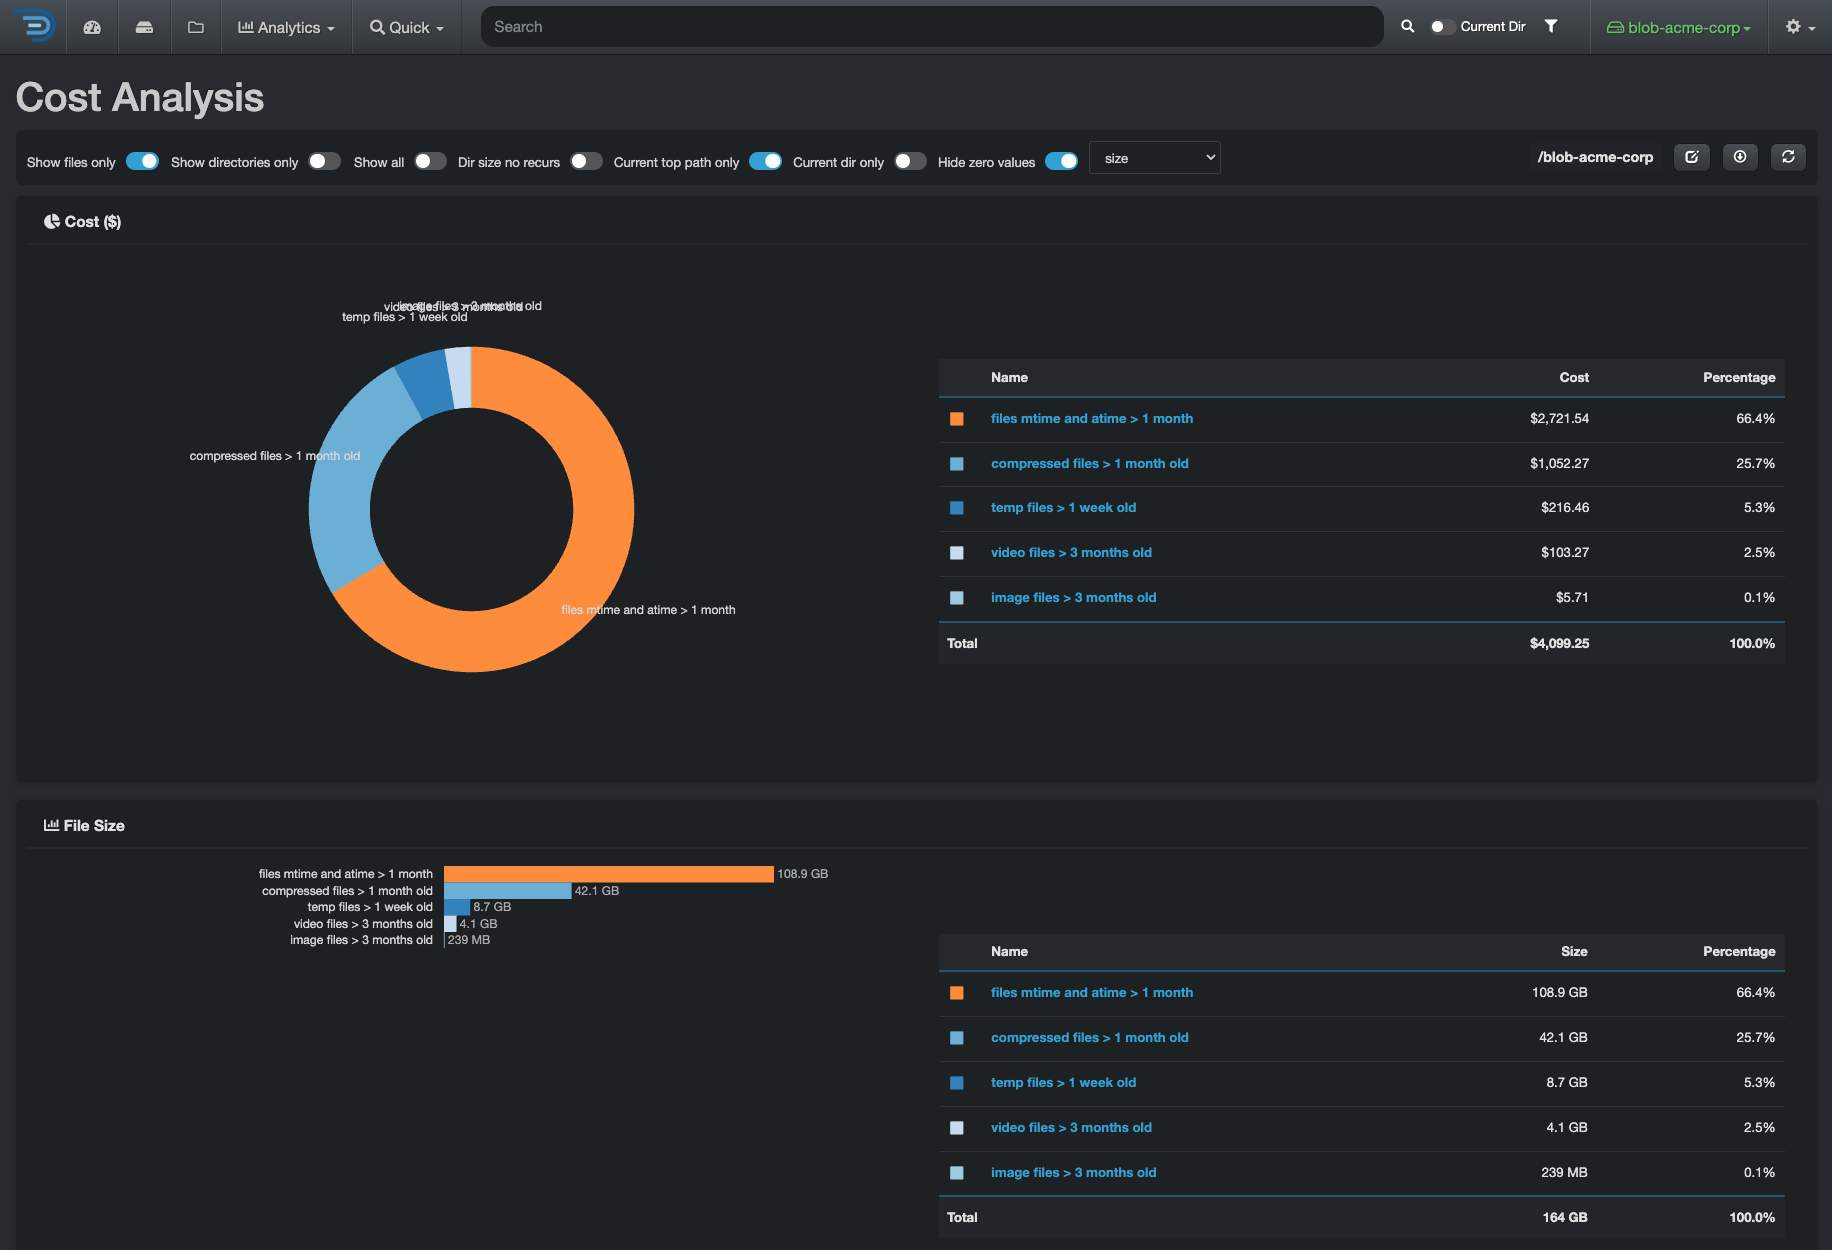
The second view is Cost Analysis. It shows what your files cost each month, grouped the way you set it up, such as by project, customer, storage tier, or file age. Prices can be set for an entire volume and adjusted for any folder, and every folder shows the total cost of everything inside it. This demo groups files by age and type. On this cloud container, files untouched for a month make up two-thirds of the monthly bill, a figure a storage lead can bring to finance.
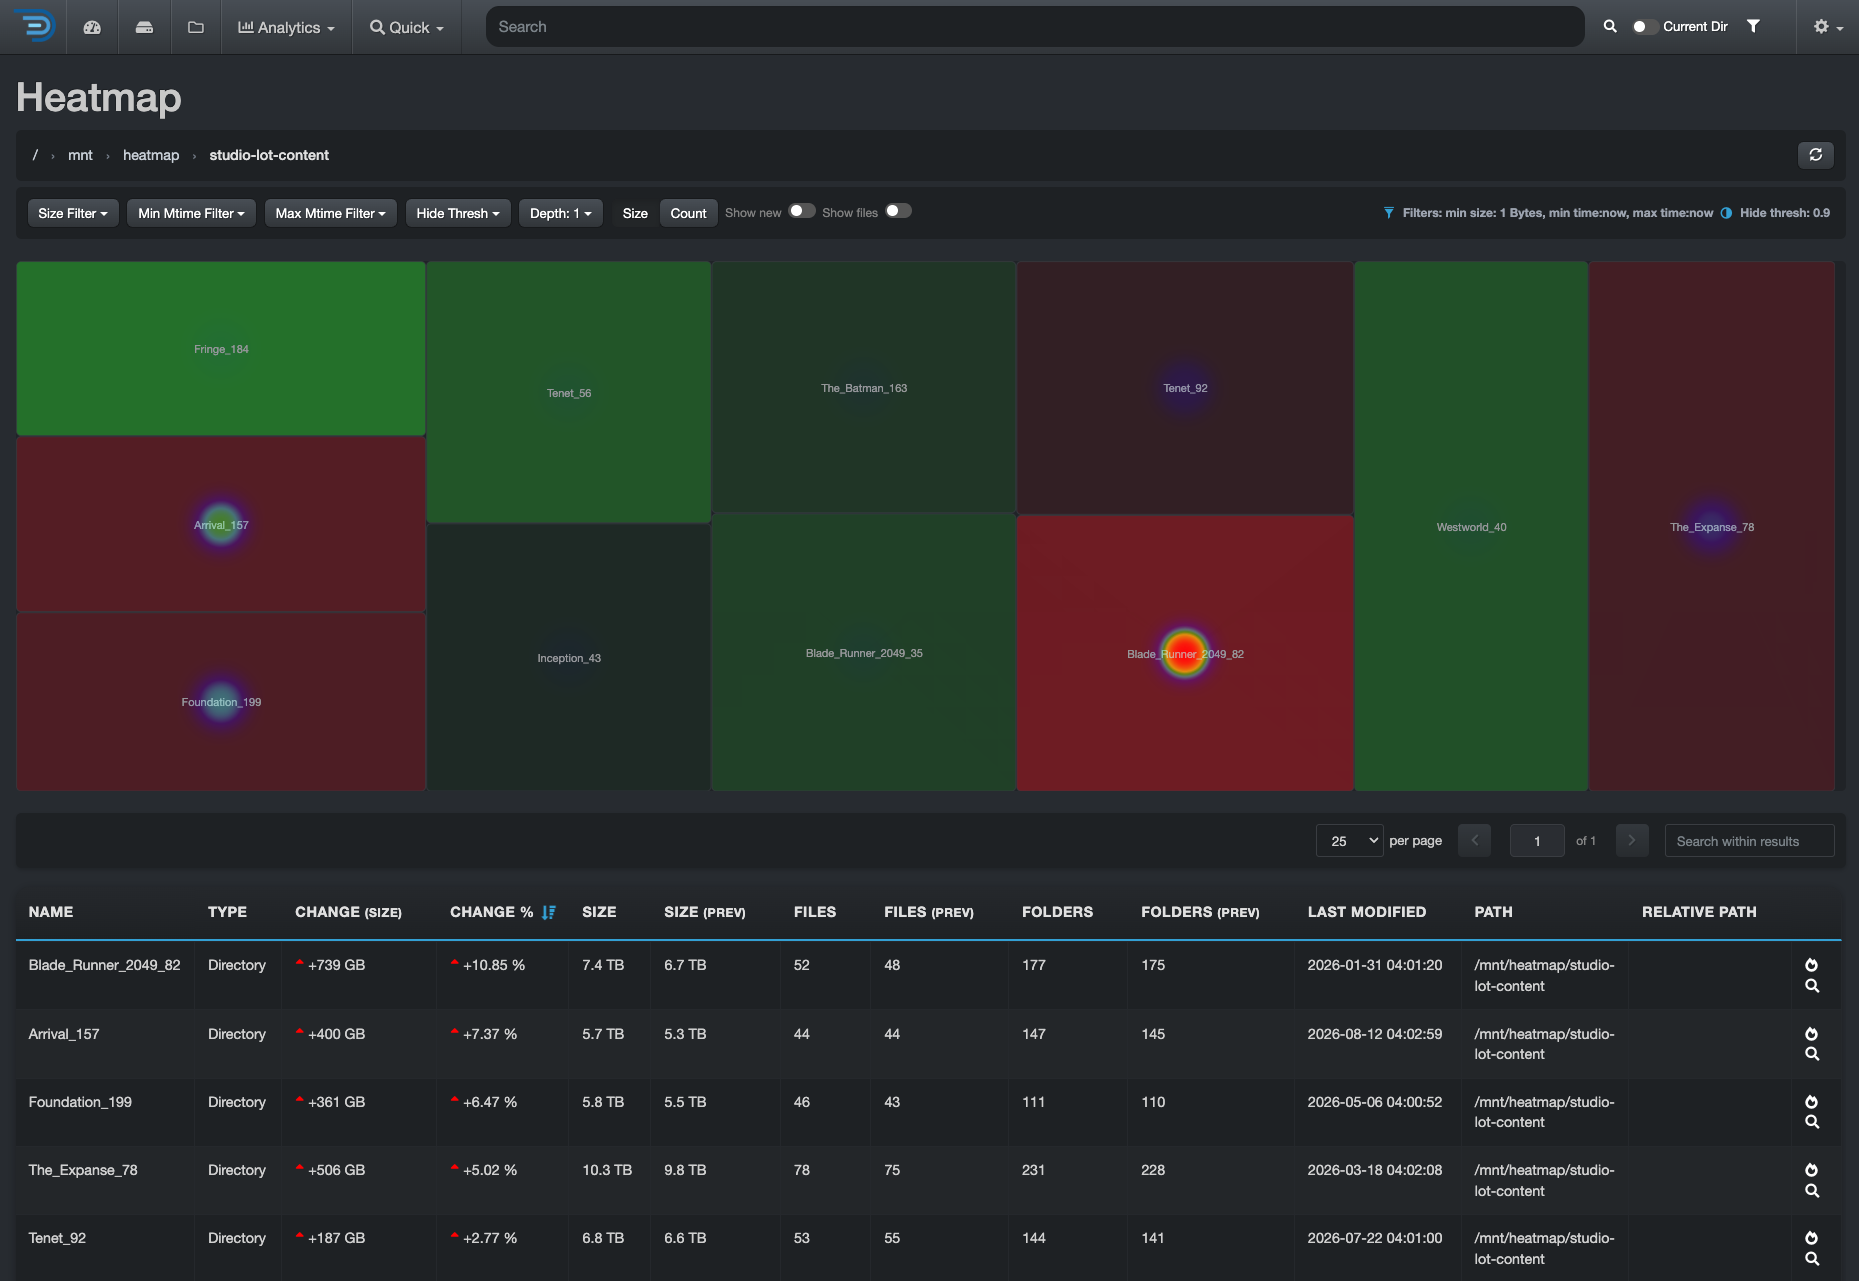
The third view is the Heatmap. It compares the current index of a share with an earlier one and shows what changed between the two. Each tile is a project folder, shown in red if it grew and green if it shrank. The table below gives each change in size, in percent, and in files added or removed. One project on this share added 739 gigabytes (GB) since the last index. The storage system reports that the volume grew. The heatmap shows which project caused it, and in which period.
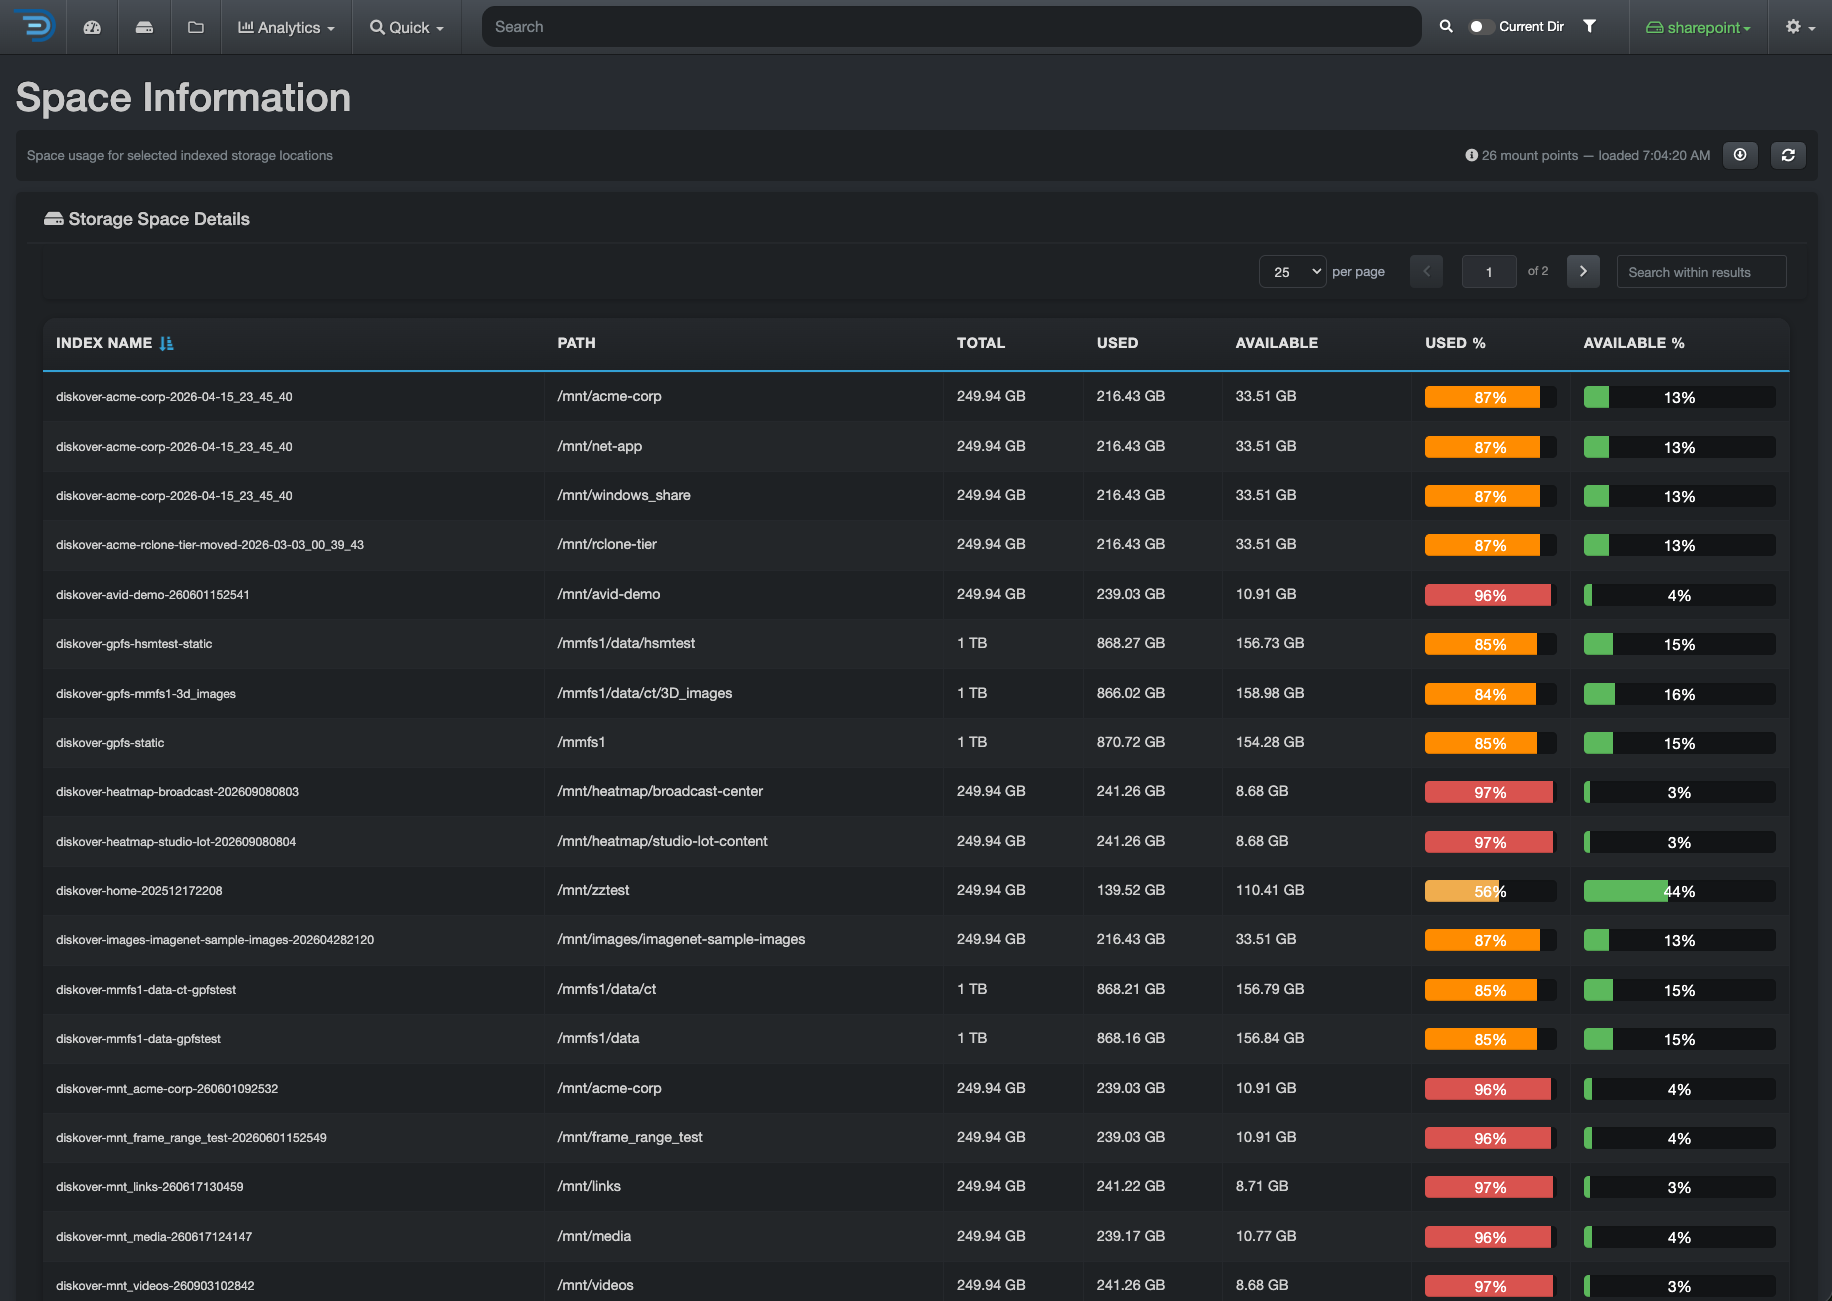
The fourth view is Space Information. This is the view most people expect from their storage console. Here, it shows your entire data estate on one page: all 26 storage locations in this demo, whichever system each one runs on, with total, used, and free space for each. A bar turns red when a location passes a set limit, and the files that filled it are two clicks away.
Every one of these views is a query against the metadata catalog, and the catalog is open to the tools you already run. Diskover writes it out as Parquet for a data lake, feeds summary indices to Grafana, and streams a curated set of rows into Snowflake, so a BI dashboard can carry file facts beside the business facts it already shows. That is the point where the row tools and the file tools stop being separate answers.
How long would any one of these four views take to build from the tools you have today?
The fields that turn a listing into intelligence.
Every file comes with basic facts from the file system. Diskover indexes them by default, including name, path, extension, size, allocated space, owner, group, and the dates the file was last modified, accessed, and changed. Those facts are the starting point. Intelligence is what gets added to them.
Diskover indexes every file across every storage system and writes those facts into a metadata catalog. Enrichment plugins then add the fields the file system leaves out: a cost per gigabyte from the tier the file sits on, an image’s dimensions, a media file’s codec, a tag that says which project or retention class it belongs to, a directory lineage that says which department produced it. The data stays in place while the catalog is built, and it moves only when a workflow calls for it.
The catalog is what makes the four views above possible. The age bars come from timestamps. The cost rows come from size and the tier’s price. The heatmap comes from two indexes of the same share, taken at two points in time. The space list comes from the same indexes again. One catalog, which is why the same platform answers questions from IT, from finance, and from the governance team.
A 2025 Ponemon Institute survey found that organizations considered, on average, 36% of their stored data “dark” or unclassified. A file system inventory establishes what exists. Enrichment adds the business context needed to classify it, evaluate its value, and decide what to do with it.
From a chart to a decision, with a person in the loop.
A dashboard that describes the estate is the first half of file-level data intelligence. The second half is what happens next.
A 2025 Sisense survey of 500 organizations found that 76% had made business decisions without consulting available data because it was too difficult to access. The gap between the chart and the decision is where most of that 76% lives. Closing it means the person who owns the question can ask it directly and get back files rather than a report to interpret.
That is how Diskover is built to work. A storage lead asks the AI connector, in plain language, which backup files older than two years still have an owner in the finance group, and gets back the matching files with a recommended action attached: tag, tier to archive, or delete. The action runs after they approve it, and only then. AI-assisted, human-approved. The chart told them what was true. The approval is what changes it.
Who on your team would ask the first question, and what would they do with the answer?
Four questions to ask any vendor who says data intelligence.
The word will keep being used, so the useful move is to ask what stands behind it. Four questions settle it in one meeting.
| ASK | WHAT A FILE-LEVEL ANSWER SOUNDS LIKE |
|---|---|
| What does it describe: rows, volumes, or files? | A file, with its name, path, size, owner, and timestamps, rather than a row or a volume. |
| Where does it look? | Every storage system, tier, and location in the estate, in one catalog, rather than one array or one cloud. |
| What does it carry beyond the file system’s basic facts? | Cost, business context, tags, lineage, and vendor-specific attributes, attached by plugins. |
| What can it do with the answer? | List the matching files, recommend an action, and run it after a person approves. |
A vendor whose intelligence is about rows will answer the first question honestly, and that is the right tool for a row problem. A vendor whose intelligence is about volumes will answer the second, and that is the right source for a capacity plan. When the ticket on your desk is about files, the answers in the right column are the ones to look for.
The right column is how Diskover answers all four, and the views above are examples of what those answers look like on screen.
What the term should have meant all along.
Data intelligence was always a promise to describe what you own well enough to act on it.
- For records, that promise was kept a long time ago.
- For storage, the array keeps it every day.
- For files, which make up about 90% of business data, according to IDC, the promise is kept by file-level data intelligence: a catalog that knows every file, carries the fields the file system leaves out, and answers the question in the words it was asked.
The next time a slide says data intelligence, ask what it can see. The answer tells you which of your problems it will solve.
KEY TAKEAWAY
Match the intelligence to the answer you need.
Three products can say data intelligence and mean three different things: rows, volumes, or files.
A question about files needs one catalog of every file in every location, enriched with cost and ownership, and able to act once a person approves.
Ask what a tool can see before you ask what it costs.
Ask what it can see. Then decide.
Diskover indexes every file across your estate, enriches it with the fields that make it useful, and turns each question into a list you can act on.